The performance of a quantum error-correction process is determined by the likelihood that a random configuration of errors introduced to the system will lead to the corruption of encoded logical information. In this work we compare two different variants of the surface code with a comparable number of qubits: the surface code defined on a square lattice and the same model on a lattice that is rotated by π/4. This seemingly innocuous change increases the distance of the code by a factor of √2. However, as we show, this gain can come at the expense of significantly increasing the number of different failure mechanisms that are likely to occur. We use a number of different methods to explore this tradeoff over a large range of parameter space under an independent and identically distributed noise model. We rigorously analyze the leading order performance for low error rates, where the larger distance code performs best for all system sizes. Using an analytical model and Monte Carlo sampling, we find that this improvement persists for fixed sub-threshold error rates and large system sizes, but that the improvement vanishes close to threshold. Remarkably, intensive numerics uncover a region of system sizes and sub-threshold error rates where the square lattice surface code marginally outperforms the rotated model.
Figures9
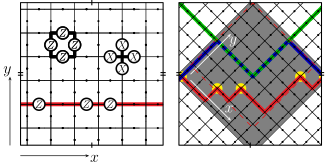
Figure 1.Square-lattice surface codes on the torus with two different orientations. (Left) The square-lattice surface code with n=72 and d=6. A star and plaquette operator are shown at the top of the figure. A least-weight error is shown along the red path at the bottom of the lattice; the red line supports an uncorrectable error of dephasing flips with weight d/2. (Right) The rotated diamond-lattice surface code with n=144 and d=12. The colored lines indicate the low-weight support of different low-weight logical operators, and the yellow points indicate right turns in the red path.
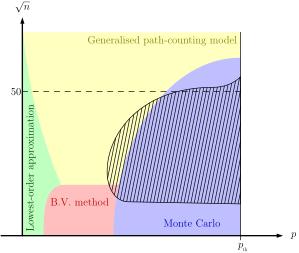
Figure 2.Summary of results. The failure probability P(p,n) of the two orientations depends on the number of qubits n and the physical error rate p. Surprisingly, we find that at error rates greater than about half the threshold error rate pth, for system sizes n≲50, the code with smaller distance outperforms the rotated variant due to entropic effects; we hatch this region in parameter space. We use a number of approaches to explore the different parts of parameter space, shown with different colors in the figure: closed expressions for p→0 (green), with γ0K=21/2≈1.6325 and 3.4142≈2+2≤γ0W≤27/2≈3.6742 for large n; Monte Carlo sampling of the finite error rate regime (blue); the splitting method, introduced for topological codes by Bravyi and Vargo, to numerically interpolate between the Monte Carlo studies and the analytic path-counting results (red); and an analytical model generalizing the path-counting method that accurately reproduces a number of features seen in the numerical studies (yellow).
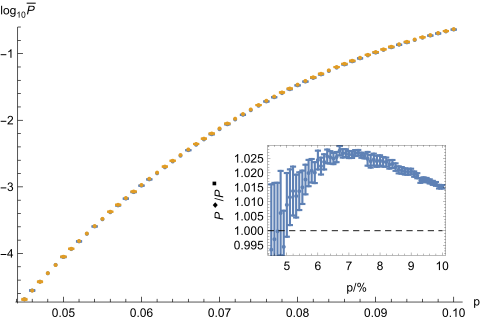
Figure 3.The logical failure rate for the square lattice model with nK=1152 (dK=24), shown in blue, compared with that of the rotated lattice with nW=1156 (dW=34) in yellow, calculated using η∼108–109 samples. The inset shows the ratio of the failure rates of the two models, where a ratio in excess of unity marks the region where the square lattice model outperforms the rotated model using four fewer qubits.
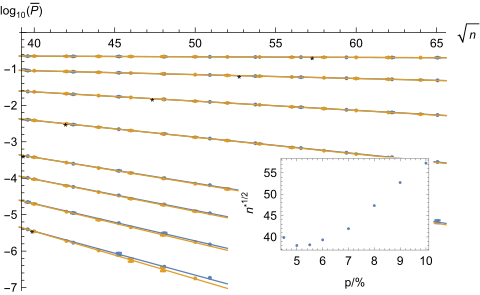
Figure 4.Monte Carlo data comparing large system sizes of the original (blue) and rotated (yellow) lattice for error rates p=4.5%,5%,5.5%,6%,7%,8%,9%,10%, running from the bottom fittings to the top fittings. The inset shows the system size L∗ where the linear fittings of the two models cross, for each value of p. These crossing points mark the top of the hatched region in Fig. 2, above which the rotated lattice begins to outperform the original square lattice model.
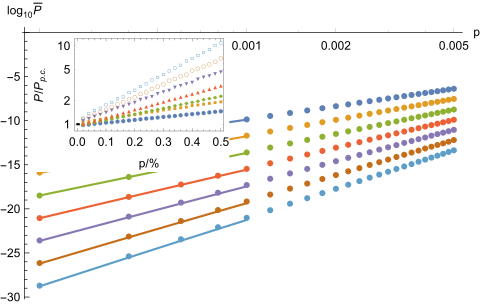
Figure 5.Logical failure rates obtained using the numerical method due to Bravyi and Vargo, compared with the low physical error rate bound given in Eq. (14), as a function of physical error rate p, for system sizes n=10,12,…,22. The inset shows the ratio of the failure rates obtained numerically to the low error rate bound; the convergence to unity as p vanishes shows good agreement with the approximation.
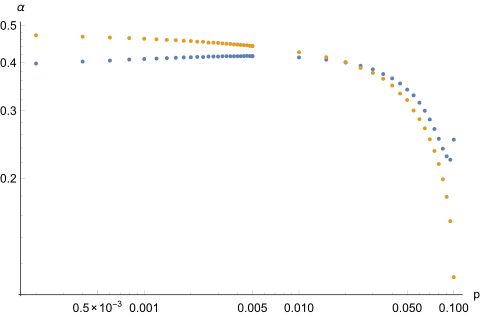
Figure 6.The function α(p) from the fitting Ansatz, using Monte Carlo samples for p>0.05 and the splitting method otherwise. We collect data for system sizes 10≤n≤22. The square (rotated) lattice model is shown in blue (yellow). We observe slow convergence of α to 1/23/2 (1/2) for the square (rotated) lattice models, as predicted using the path-counting formulae presented in the previous section. We also observe a crossing in the functions αK(p) and αW(p) at around p∼2%.
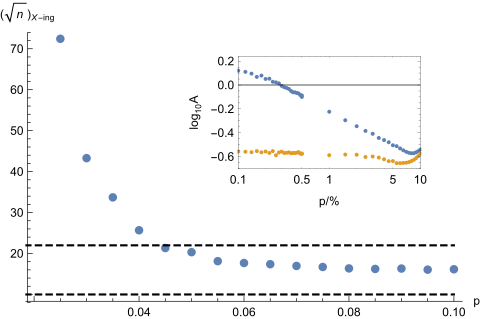
Figure 7.The system sizes at which the square-lattice model begins to outperform the rotated-lattice model as n increases. We also mark n=10 and n=22 by black dashed lines, indicating the range of system sizes for which we collect data. These data points mark the lower boundary of the hatched region shown in Fig. 2. The inset shows logA as a function of p, between the path-counting regime and the threshold error rate, for the square-lattice model (blue) and the rotated-lattice model (yellow).
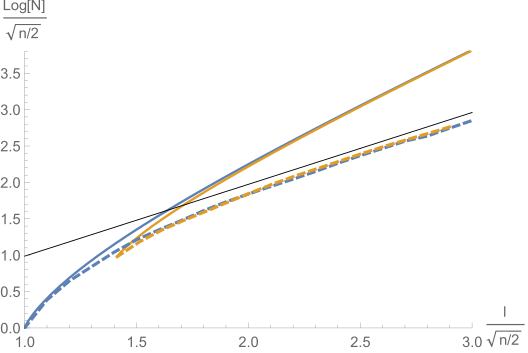
Figure 8.The logarithm of the number of paths, normalized by n/2 in the limit of large n. The dashed curves represent our estimates of NconK(l,n) and NconW(l,n), and the solid curves are the exact limit of Nunc(l;x,y) for (x,y)=(n/2,0) and (x,y)=(n/2,n/2), calculated using Eq. (64). The two curves asymptotically approach one another for large l/n/2. The blue and yellow curves are for the square and diamond lattice respectively; the number of constrained and unconstrained paths match at l=d for both orientations. The black line, which both NconK(l,n) and NconW(l,n) appear to approach, is N=cl where c=2.638… is the square-lattice connective constant.
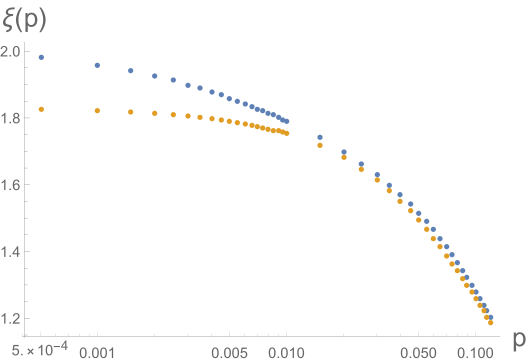
Figure 9.We identify ξ(p) numerically by fitting the data obtained by Monte Carlo and the splitting method, across a large range of p, to the model in Eq. (19). We used d=10 for the rotated lattice and d=14 for the square lattice. The Nncl(l) were estimated to within 2% accuracy for both models by sampling. There are some deviations from the expected behavior, which we expect come from small-size effects: for example, the blue curve appears to be slightly below the expected value of 2 for ξK(0), and the values ξK(pth) and ξW(pth) appear to differ slightly.
We have taken a number of different approaches to explore the
configuration space of errors that can cause logical failure for the
surface code with different lattice geometries. We have found that, while
it pays to optimize the distance of the code, entropic factors can have a
significant effect on the performance of codes at modest physical error
rates.
It will be interesting to explore the entropic contribution on other codes
with improved encoding rates, such as twisted surface codes, color codes,
stellated color codes and hyperbolic codes, to determine how entropic
considerations affect logical failure rates there. Indeed, one could
imagine that codes that require a reduced number of physical qubits to
realize a code of a given distance may suffer adversarially from entropic
effects. Further, for the system sizes we have studied, the logical
failure rates of the two different codes are almost indistinguishable
until the physical error rate is an order of magnitude below threshold. We
might like to account for this when we consider the change in distance of
fault-tolerant quantum systems as we perform logical operations.
It may also be worthwhile studying entropic effects during fault-tolerant
error correction. Correlated errors that occur during syndrome extraction
manifest themselves as diagonal bonds during error correction; extensions
of the present work may consider choosing circuits to minimize these
effects. Recently, flag fault tolerance has been considered in topological
codes to minimize these correlated errors. One might view the extra
resources used to implement these circuits as an additional hardware
expense used to reduce logical failure rates by minimizing the
configuration space of errors.
Ultimately, it will be very useful to determine bounds on the extent to
which the physics of quantum error-correcting codes will permit us to
minimize entropic factors in the logical failure rate, to help design
better fault-tolerant quantum-computational protocols in the future.