Skip to content

Metrology of microwave fields based on trap-loss spectroscopy with cold Rydberg atoms

R. Duverger, A. Bonnin, R. Granier, Q. Marolleau, C. Blanchard, N. Zahzam, Y. Bidel, M. Cadoret, A. Bresson, S. Schwartz

Physical Review Applied 22, 044039 (2024) · 10.1103/PhysRevApplied.22.044039 · arXiv:2404.17445

Download .bibRead preprint

Abstract

We demonstrate a new approach for the metrology of microwave fields based on the trap-loss-spectroscopy of cold Rydberg atoms in a magneto-optical trap. Compared to state-of-the-art sensors using room-temperature vapors, cold atoms allow longer interaction times, better isolation from the environment and a reduced Doppler effect. Our approach is particularly simple as the detection relies on fluorescence measurements only. Moreover, our signal is well described by a two-level model across a broad measurement range, allowing in principle to reconstruct the amplitude and the frequency of the microwave field simultaneously without the need for an external reference field. We report on a scale factor linearity at the percent level and no noticeable drifts over two hours, paving the way for new applications of cold Rydberg atoms in metrology such as calibrating blackbody shifts in state-of-the-art optical clocks, monitoring the Earth cryosphere from space, measuring the cosmic microwave background or searching for dark matter.

Figures5
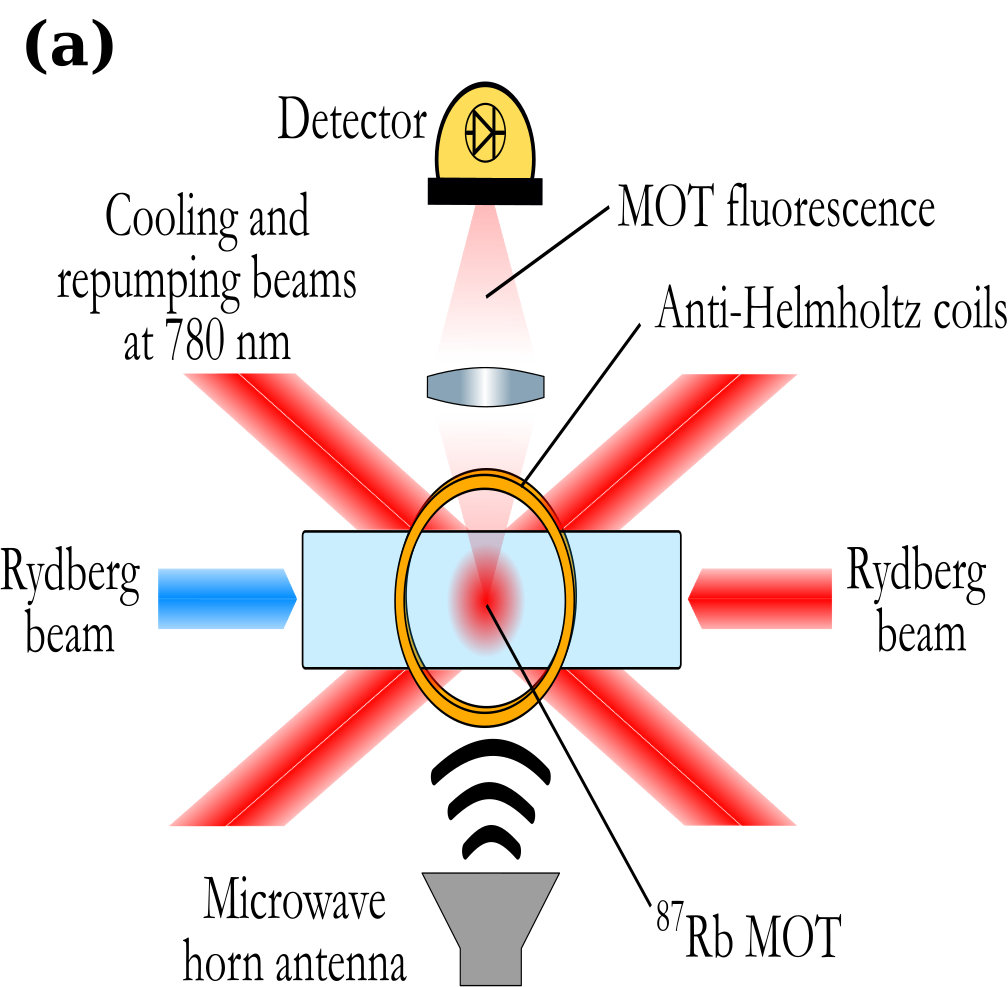
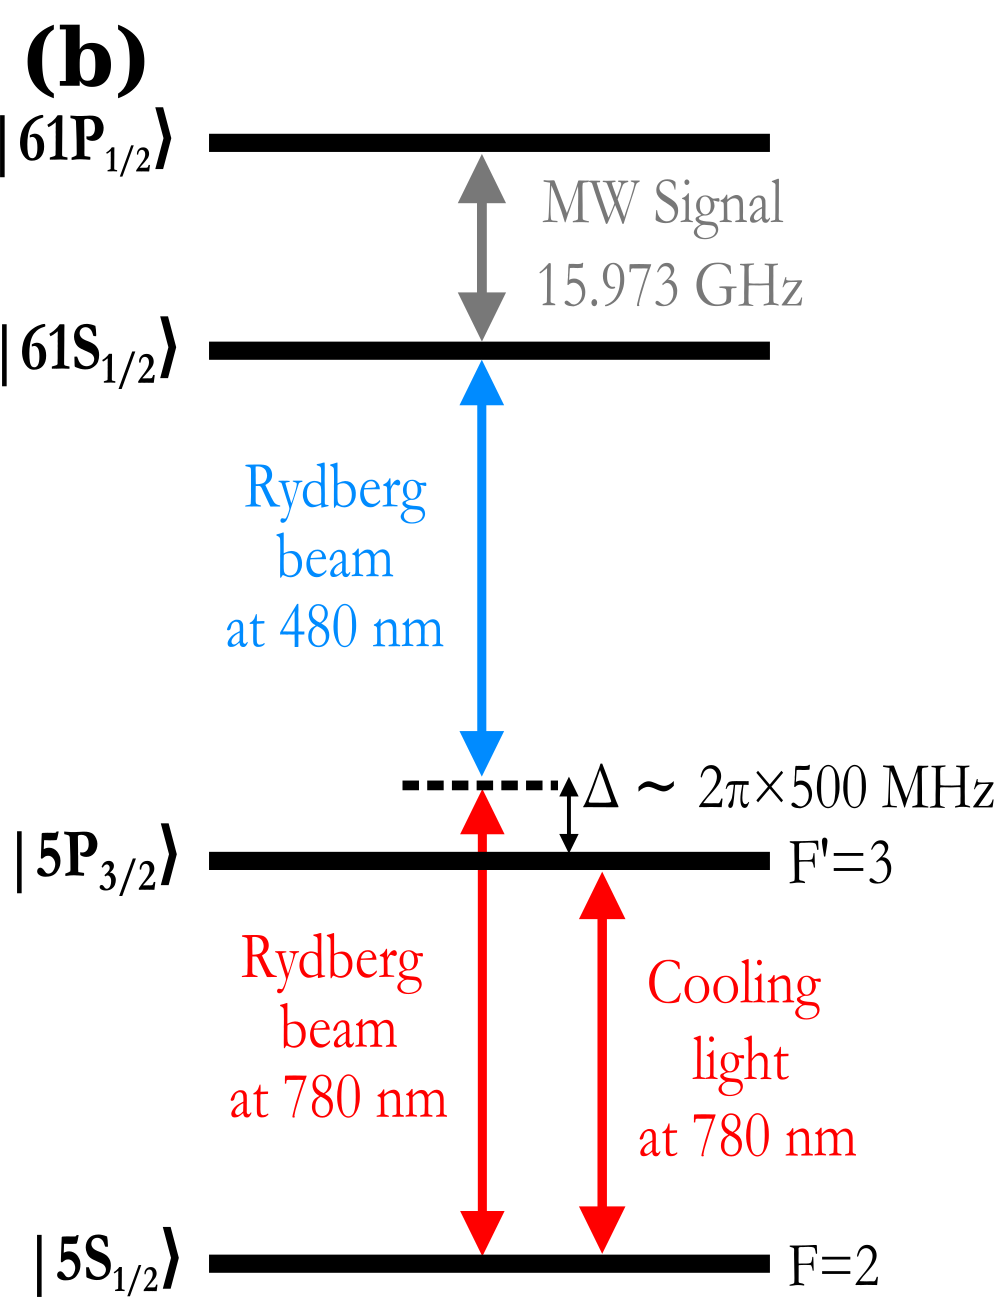
Schematic of the crossed dipole trap, MOT coils, Rydberg beams, microwave horn and fluorescence detector.Atomic energy-level diagram showing the two-photon Rydberg coupling and the microwave transition between Rydberg states.
Figure 1. (a) Schematic view of the experimental setup. (b) Energy levels and couplings involved in the measurement process.
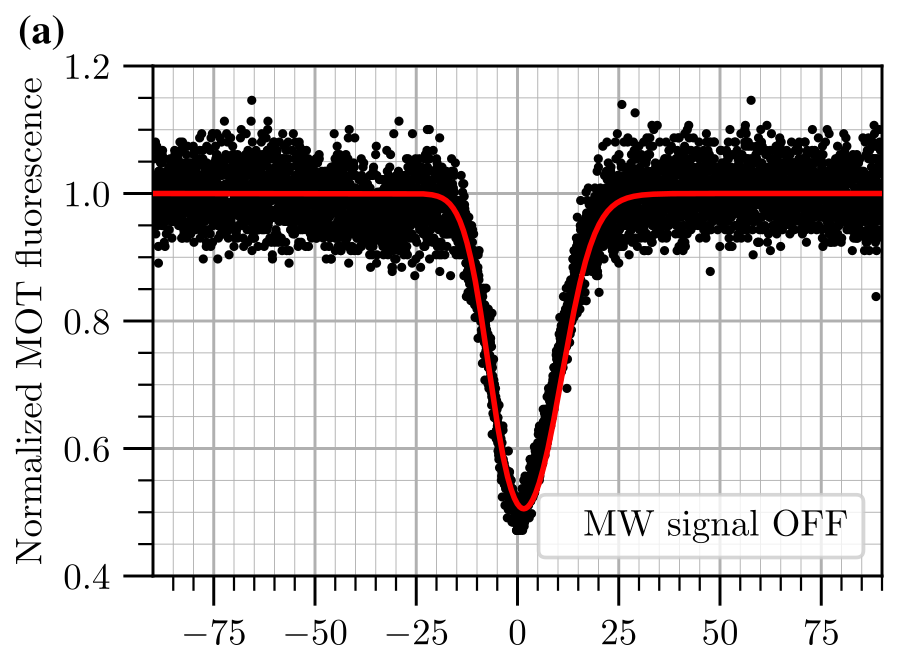
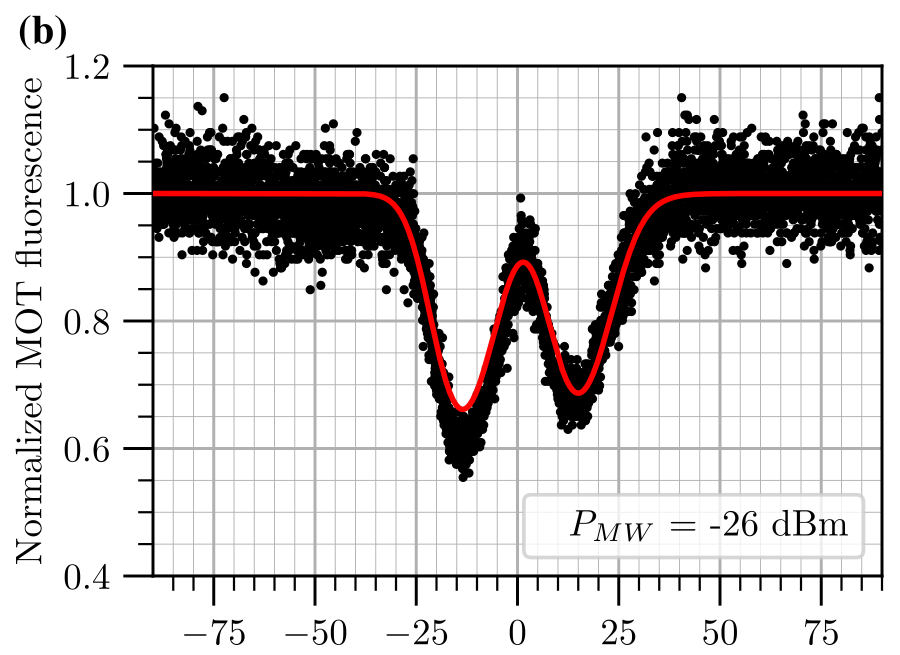
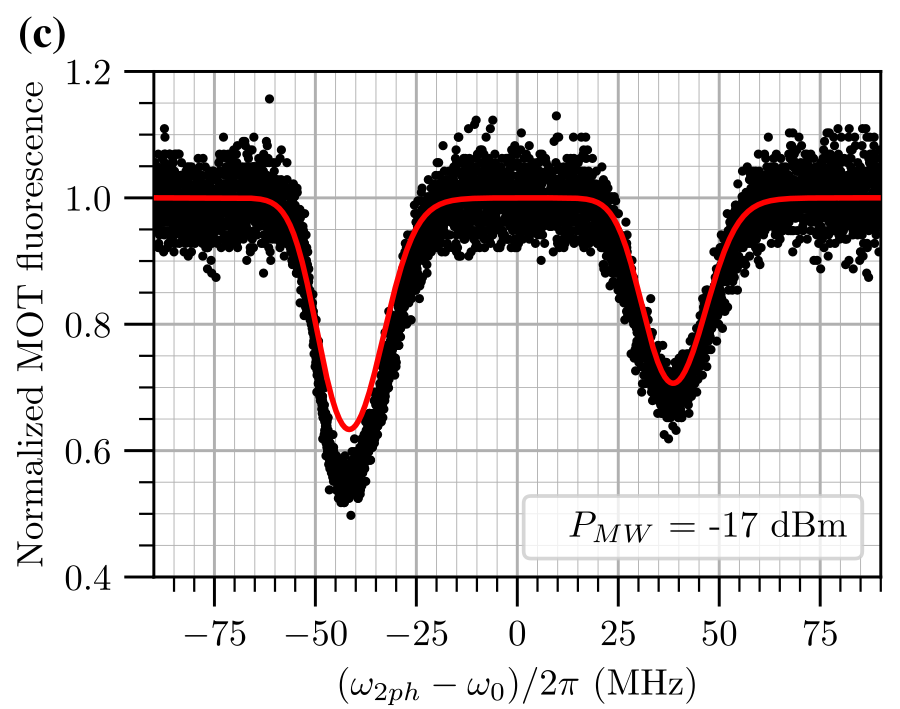
Normalized MOT fluorescence versus two-photon detuning with the microwave field off, showing a single dip.Normalized MOT fluorescence versus two-photon detuning with the microwave field on at -26 dBm, showing a doublet of two dips.Normalized MOT fluorescence versus two-photon detuning with the microwave field on at -17 dBm, showing a doublet of two dips.
Figure 2. MOT fluorescence as a function of the two-photon detuning for various applied MW powers, ω2ph\omega_{2ph} being the sum of the angular frequencies of the two Rydberg lasers. The positions of the two dips in (b) and (c) correspond to ω2ph=ω±\omega_{2ph} = \omega_\pm as defined by Eq. (2). Black dots are experimental data, and red curves were derived from the rate-equations model described in the text. The scanning rate is 2 MHz/s.
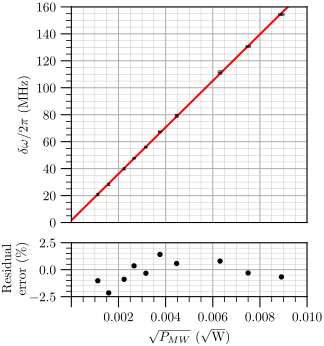
Measured Autler-Townes splitting versus the square root of the applied microwave power, closely following a linear fit, with a residual-error plot below.
Figure 3. Measured Autler-Townes splitting as a function of the square root of the MW power at 15.973 GHz sent to the antenna. The error bars on the x-axis correspond to an estimated uncertainty of 0.1 dB on the applied MW power; those on the y-axis reflect the 2σ standard deviation of 10 successive measurements for each point, typically smaller than 0.5 MHz. The red curve is a linear fit to the data, yielding an intercept of 1.6±0.51.6 \pm 0.5 MHz.
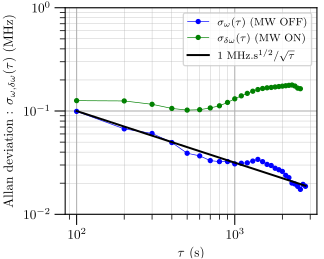
Log-log plot of Allan deviation versus integration time for the bare transition frequency and for the Autler-Townes splitting frequency, the former following a 1-over-root-tau trend.
Figure 4. Overlapping Allan deviation of the transition frequency σω\sigma_\omega in the absence of MW (blue) and of the Autler-Townes splitting frequency σδω\sigma_{\delta\omega} when a MW signal at 15.973 GHz and −23 dBm is sent to the antenna (green). The black line is a guide to the eye showing a 1/τ1/\sqrt{\tau} trend of the data in blue.
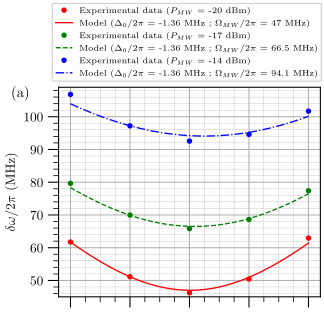
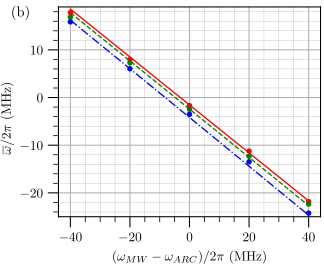
Autler-Townes splitting versus microwave detuning for three microwave powers, each following a parabola with fitted curves.Autler-Townes doublet center frequency versus microwave detuning for three microwave powers, each nearly linear with fitted curves.
Figure 5. (a) Measured Autler-Townes splitting versus MW detuning, relative to the theoretical transition frequency of 15.973 GHz, for three powers sent to the antenna (PMW=20P_{MW} = -20 dBm, red; 17-17 dBm, green; 14-14 dBm, blue). (b) Measured Autler-Townes doublet center frequency versus MW detuning, from the same data set. In both plots the data are fitted with the model of Eqs. (3) and (4): for an initial value of Δ0\Delta_0, three independent fits (one per power) find three values of ΩMW\Omega_{MW}; the value of Δ0\Delta_0 is then iterated until the distance between the fits and the data is minimized. This yields Δ0=2π×1.36\Delta_0 = -2\pi \times 1.36 MHz, and ΩMW/2π=47\Omega_{MW}/2\pi = 47 MHz (red), 66.566.5 MHz (green), and 94.194.1 MHz (blue). The differing offsets of the three lines in (b) are a consequence of light shifts, detailed further in the paper’s appendix.
Supplemental figures4
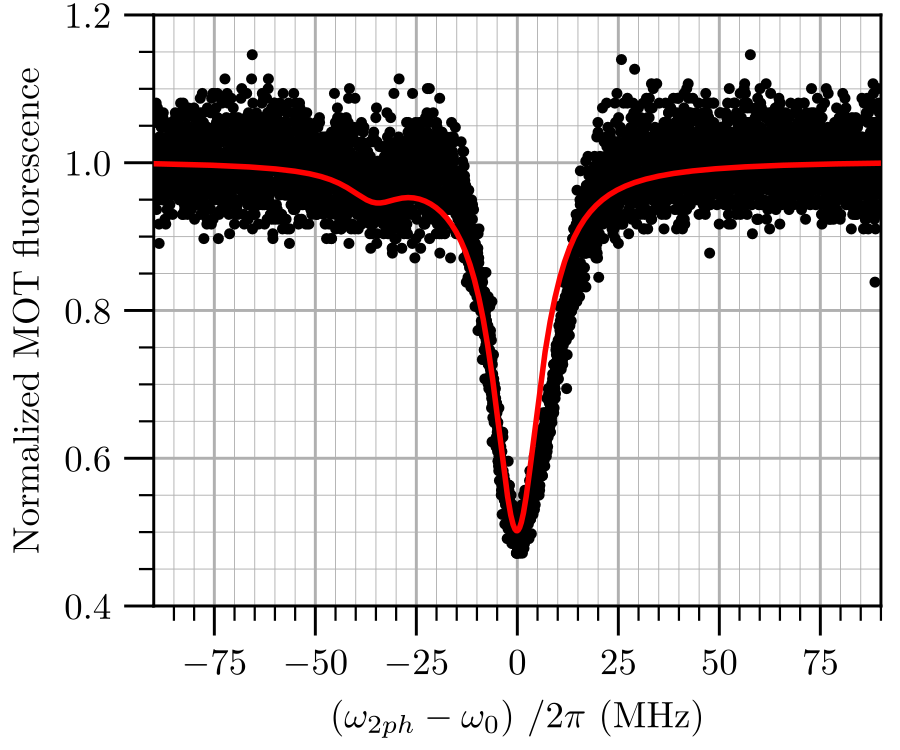
Autler-Townes splitting from the MOT cooling light, comparing a theoretical model curve to the experimental trap-loss data.
Figure 6. Autler-Townes splitting due to the coupling of 5S1/2,F=2|5S_{1/2},F=2\rangle and 5P3/2,F=3|5P_{3/2},F'=3\rangle by the cooling light. The red trace is the theoretical model and the black dots are the experimental data already presented in Fig. 2(a). The origin of frequencies for the red trace has been shifted by about 7.6 MHz to match the experimental data, corresponding to the shift induced by the MOT cooling light on the trap loss spectral features.
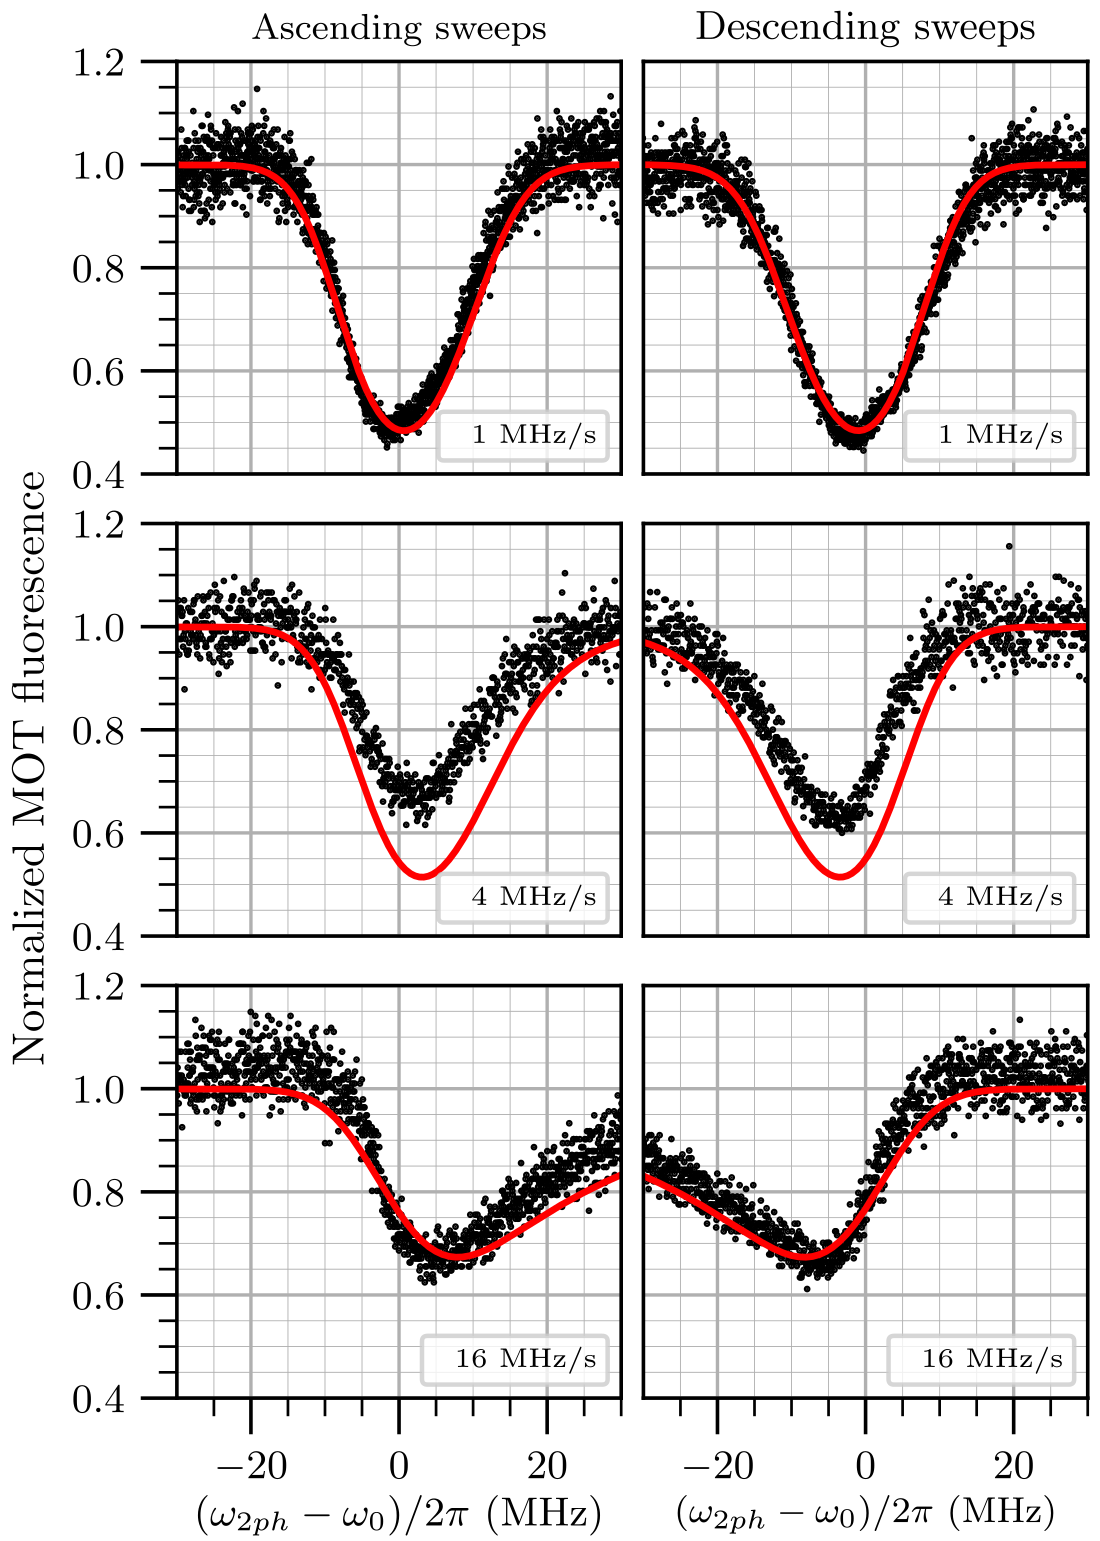
Grid of MOT fluorescence traces versus two-photon detuning at three scanning rates, for both increasing and decreasing frequency sweeps.
Figure 7. MOT fluorescence as a function of the two-photon detuning for various scanning rates (1, 4, and 16 MHz/s from top to bottom). The first (second) column corresponds to sweeps of increasing (decreasing) frequency. Black dots are experimental data, and red traces result from the rate-equations model described in the text.
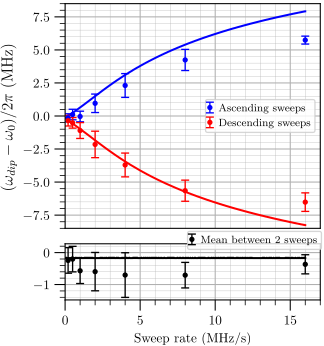
Dip frequency versus scanning rate for ascending and descending two-photon detuning sweeps, compared to a rate-equations model.
Figure 8. Estimated frequency corresponding to the minimum of each fluorescence trace, for various scanning rates and directions. Dots are experimental data, and curves are theoretical predictions from the rate-equations model described in the text.
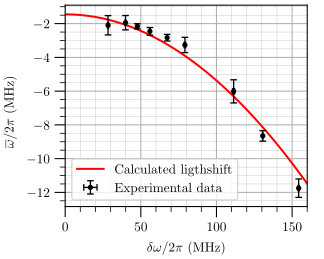
Average Autler-Townes doublet position versus microwave power, compared to a calculated light-shift curve.
Figure 9. Average position of the Autler-Townes doublet versus MW power. The red line is the calculated light shift (δ1LS+δ2LS)/2(\delta_1^{LS}+\delta_2^{LS})/2 with a 1.5-1.5 MHz offset to account for the MW frequency not being perfectly resonant with the bare 61S1/261P1/2|61S_{1/2}\rangle \leftrightarrow |61P_{1/2}\rangle transition.
Conclusion

In this paper, we have demonstrated and characterized a new method to measure MW fields with Rydberg atoms based on trap-loss spectroscopy in a magneto-optical trap. This method is particularly simple as the detection scheme relies on fluorescence measurements only. By using a two-photon transition highly detuned from the intermediate state, we realize a situation where the frequencies of the spectral lines are well described by a coupled two-level system, which is particularly favorable for the linearity of the sensor in the resonant case. In the non-resonant case, this simple two-level behavior allows in principle the reconstruction of both the amplitude and the frequency of the applied MW field from the Autler-Townes splitting frequency and doublet center frequency, provided the light shifts induced by the MW field are taken into account. The maximum range that we achieved for the measurement of the microwave power, on the order of 160 MHz, is already much higher than for electromagnetically induced absorption in cold atoms, and could be possibly much larger if the coupling (blue) laser was scanned instead of the probe (infrared) laser. The maximum range that we achieved for the measurement of the microwave frequency is on the order of ±50 MHz around the resonance frequency, typically set by the value of the MW Rabi frequency on resonance. Future directions to improve the metrological performance of our experimental setup include a better control of the intensity of the cooling beams, Rydberg beams and their associated polarizations, as well as a better control of the MW power effectively sent onto the atoms. In the longer term, one could get rid of the MOT broadening by adapting the setup to perform pulsed MOT operation, optical molasses or even dipole traps.

In comparison with state-of-the-art techniques based on Rydberg EIT in room-temperature vapor cells, this new approach has several advantages, including reduced Doppler and transit time effects, better long-term stability as the atoms are more isolated from their environment, and the possibility to measure simultaneously the amplitude and the frequency of the electric field. On the other hand, the time needed to perform a single measurement with this new approach is much higher than for vapor cells, as it is limited by the response time of the magneto-optical trap, on the order of one second in the present work.

With a long-term frequency stability equivalent to a resolution of 5 μV/cm at 2500 s and no noticeable drift over this time period, this new measurement technique appears to be particularly well suited for metrology experiments where accuracy, long-term stability and high resolution at large integration times are required. This includes in particular technological applications such as the characterization of radiofrequency and MW equipment or new concepts of radar or RF antennas, where the long-term stability would be brought by cold atoms and the high bandwidth by Rydberg EIT in a hot vapor cell. Controlling the external degrees of freedom of the cold atoms could also be used for high-resolution THz imaging, or to extend the measurement range of Rydberg sensors by making different atoms resonant with different microwave frequencies, for example using a gradient of electric field. This platform also holds great prospects for scientific applications such as blackbody-shift measurements in state-of-the-art optical clocks, monitoring the Earth cryosphere from space, measuring the cosmic MW background, or searching for axions or other forms of dark matter.

← All publications